Grafana allows you to query, visualize, alert on and understand your metrics no matter where they are stored. With Grafana, you can create, explore, and share beautiful dashboards with your team and foster a data driven culture.
Databend Cloud offers integration with Grafana. In this post, I will demonstrate how to create a dashboard for your data in Databend Cloud using Grafana, using the Anonymized Web Analytics dataset (hits_v1) from ClickBench as an example. Databend Cloud provides this dataset as a data loading sample out-of-the-box. To load the data into Databend Cloud, you can click Load Data after logging in, and then select Anonymized Web Analytics Data.TSV (7.5G) from the available datasets.
Before integrating, you need to refer to the Grafana Install Guide and set up an instance of Grafana in your environment.
Step 1. Install Databend Data Source Plugin
Follow the Tutorial: Integrating with Grafana to install the Databend Data Source Plugin.
Step 2. Create Data Source
- On the sidebar of the Grafana homepage, click the gear button, and then select Data sources.
- On the Data sources tab, select Add new data source.
- Search for and select the data source type .
Altinity plugin for ClickHouse - Configure the data source. To obtain the URL and SQL account information for the Databend Cloud warehosue, refer to https://docs.databend.com/using-databend-cloud/warehouses/connecting-a-warehouse
| Setting | Description |
|---|---|
| URL | The host address of the Databend Cloud warehouse, for example: |
| Access | Select “Server (default)”. |
| Auth | Select "Basic auth". |
| User/Password | After selecting "Basic auth", please fill in the SQL username and password for connecting to the warehouse in the Basic Auth Details. |
| Additonal | Select "Add CORS flag to requests". |
- Click Save & test. If the page displays , it means that the data source has been successfully created.
Data source is working
Step 3. Create Dashboard
- Click the Dashboards button in the sidebar on the Grafana homepage, and then select New Dashboard > New Panel.
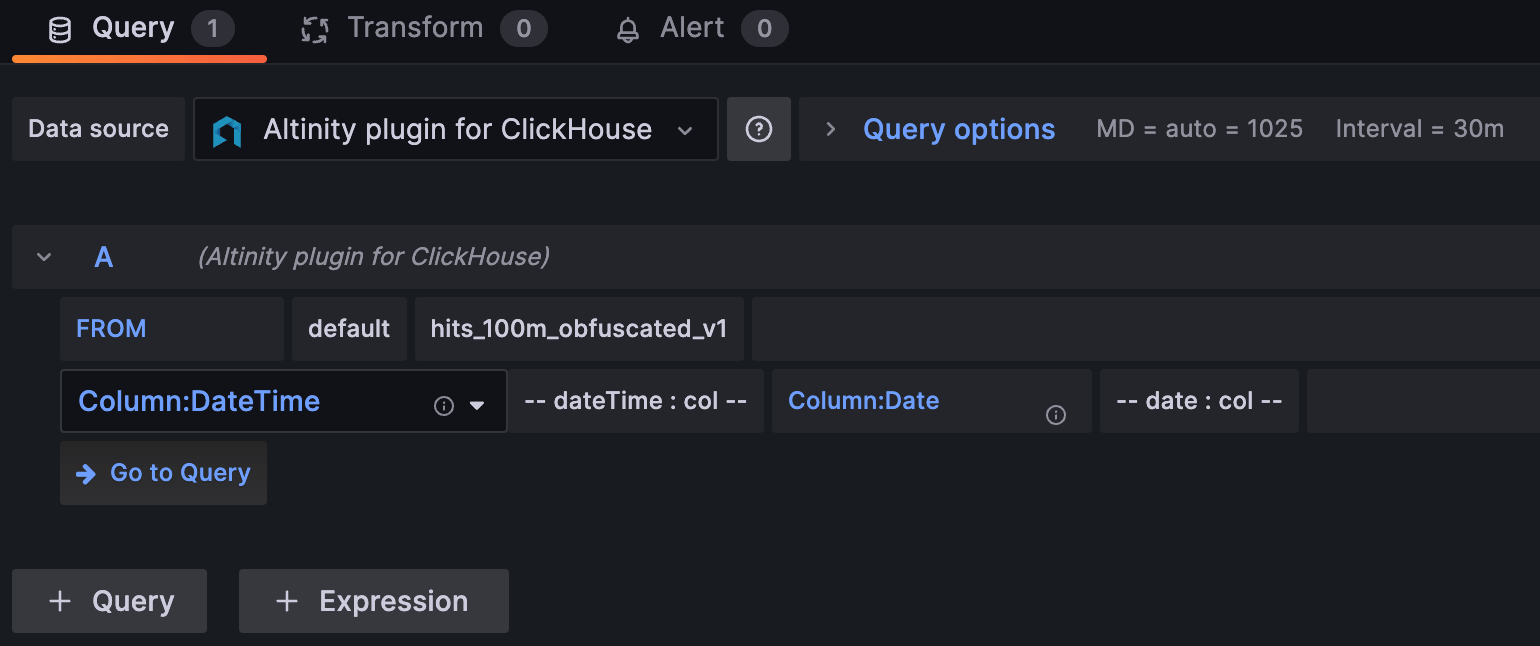
- Select the data source created in Step 2, and then select the database and
defaulttable in order after FROM.hits_100m_obfuscated_v1

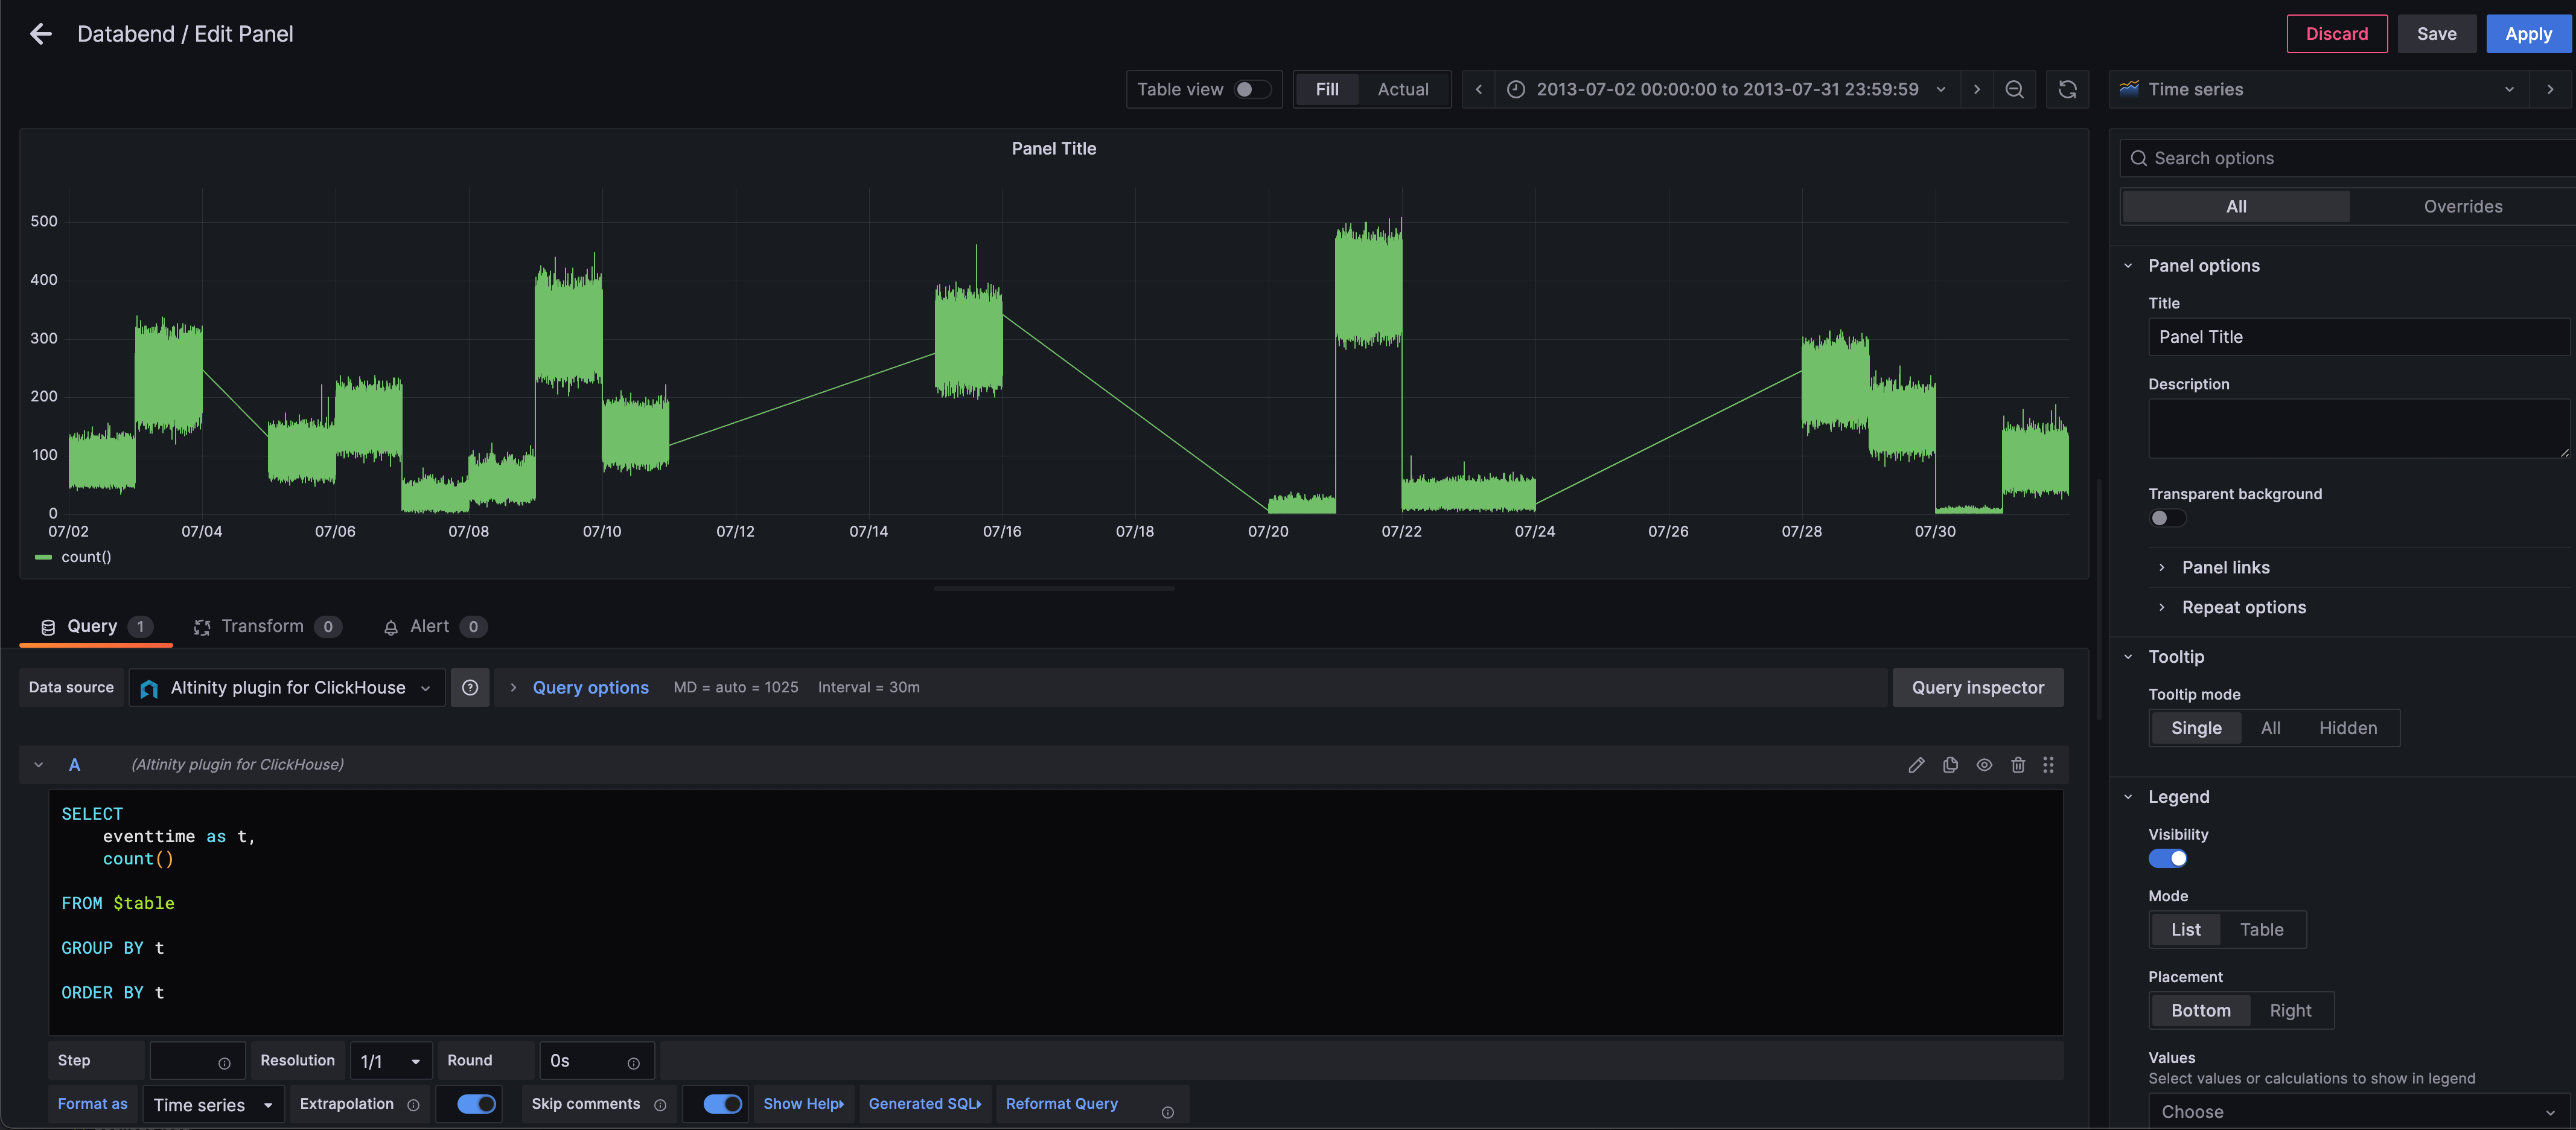
- Click Go to Query, then copy and paste the following SQL statements:
SELECT
    eventtime as t,
    count()
FROM $table
GROUP BY t
ORDER BY t
- After a short moment, the view will appear at the top of the page. Then click Save in the upper right corner.

Subscribe to our newsletter
Stay informed on feature releases, product roadmap, support, and cloud offerings!


