
Trace Is Evals: Data Engineering for Agent Trace Analysis and Attribution
 DatabendLabsJun 22, 2026

AI agents are moving from demos into long-running production workflows. That shift changes what we need from the data layer.
In the chatbot era, the main question was whether the model could answer a single prompt. In the RAG era, the question became whether the model could retrieve and use the right context. In the agent era, the harder question is operational:
When an agent runs for three hours, spends $12, and fails, where did it go wrong?
If it succeeds, which step actually made the difference? And when you change the prompt, add a tool, or switch models, how do you know whether the system improved or just got lucky?
This is no longer just a prompt tuning problem. It is a harness engineering problem.
The core idea is simple: Trace is Evals.
To evaluate agents, you need the full execution trace. Final pass/fail results are not enough.
From Prompt Engineering to Harness Engineering
Agent engineering has moved through three broad stages.
The first stage was Prompt Engineering. When ChatGPT first appeared, most work happened inside a chat box: ask a question, translate text, summarize a document, or run a single instruction. The main job was to tune the prompt, add examples, and improve the input for one model call.
The second stage was Context Engineering. As teams realized that general-purpose models could not answer questions about private company knowledge, RAG became the dominant pattern. Customer support bots, knowledge-base assistants, and multi-turn retrieval workflows all focused on one question: what should the model see at each step?
The third stage is Harness Engineering. Agents now use tools, operate local environments, write code, modify files, and run multi-step tasks. Products such as Claude Code, Codex, Coze, Cursor, and other coding agents are no longer just wrappers around a model. They are execution systems around the model.
A harness is the infrastructure that makes an agent useful: state management, tool mediation, context compression, constraint enforcement, progress tracking, feedback injection, and result verification.
For application builders, the harness turns a model into a controllable product. For model builders, the harness becomes a training environment where the model learns how to use tools, manage context, and complete long-running tasks.
Why Agent Evaluation Needs Trace Data
Every agent team eventually runs into the same question:
Did our change make the agent better or worse?
This is hard to answer because agents are path-dependent systems. A single tool call, one context compression step, or one error recovery action can change everything that follows.
A final result tells you almost nothing about the path.
Two agents may both complete the same task, but one may finish in five minutes while the other spends fifteen minutes looping through unnecessary tool calls. One may use a clean sequence of edits; another may choose a shell command that produces too much output and sends the run into a long detour.
If you only measure pass/fail, you miss the system.
A useful evaluation needs to answer questions like:
- Which step caused the branch?
- Where did the agent start to drift?
- Which tool call wasted the most tokens?
- Did the new prompt reduce cost or just change the path?
- Is the model weak, or is it mismatched with the harness?
That means every step must be observable. The trace is not just debug data. It is the evidence layer for evaluation, attribution, replay, and training data generation.
Harness and Model Fit: Claude Code, Evot, and Pi
One comparison makes this clear.
In an internal experiment, three agents were compared on the same task: Claude Code, Evot, and Pi. All three called DeepSeek V4 Pro.
Claude Code took about 15 minutes. Evot took about 5 minutes. Pi took about 4 minutes.
At first glance, it would be easy to blame the model. But that conclusion would be wrong.
When Claude Code used its own Opus 4.6 model on the same task, it completed the task in about 3 minutes. The difference was not only model capability. It was harness-model fit.
Claude Code’s harness is highly optimized for its own model. Its system prompts, tool names, tool descriptions, planning behavior, reminders, and execution conventions are all part of a system the model has learned to follow. When Claude Code calls a third-party model, that model may not understand the same behavioral contract.
Evot and Pi behaved differently. They are more general-purpose agents, so their execution time changed less across DeepSeek V4 Pro and Opus 4.6.
This matters for anyone building agent products. If a model performs poorly inside a third-party harness, it may not mean the model is bad. The agent and model may simply be poorly matched.
You cannot see that from the final output. You need the trace.
Agent Paths Branch Early
Agent execution is a chain reaction. Each step depends on the previous result.
Consider a task where the agent needs to modify a target file. In one run, the agent chooses an
Edit
Bash
Both runs may pass.
But one run is much more expensive, slower, and less reliable.
The branch is hidden inside the trace. To explain it, you need to store and compare the tool call, context, token usage, duration, and intermediate outputs at every step.
This is where trace analysis becomes attribution. You are no longer just asking whether the run succeeded. You are asking why one path was better than another.
What an LLM Request Actually Contains
From the user interface, an agent may look simple: give it a task, and it works through the problem.
Under the hood, each LLM request can contain a large JSON payload. That payload may include:
- system instructions
- tool definitions and descriptions
- user messages
- assistant messages
- tool calls
- tool results
- progress plans
- context summaries
- error outputs
- usage and latency metadata
In a Claude Code-style run, the first calls may not even perform the target work. They may establish task names, planning state, and progress structure. Later calls include the previous messages and results. As the run continues, the request grows because each new call carries forward prior context.
Eventually, the context window fills up. The harness must compress or summarize prior state before continuing.
That means the full session JSON is the real execution record. If you do not store it, you cannot reconstruct why the agent made a decision.
Agent Trace Is Not Traditional Trace
Traditional trace systems record service calls. A request usually lasts seconds or minutes. Fields come from SDKs or instrumentation. The schema is relatively stable. The primary metrics are latency, status, and error.
Agent trace is different.
An agent task can run for minutes or hours. Spans are appended over time. State evolves across steps. The data comes from prompts, messages, tool calls, tool results, model responses, and arbitrary runtime outputs.
The data itself is messy:
- JSON can be deeply nested.
- Fields can drift as tools and models change.
- Model outputs may not be valid JSON.
- A single trace can range from hundreds of KB to hundreds of MB.
- Agent swarms can generate very large traces with many spans over long-running tasks.
In one real-world pattern, an agent swarm may split work across multiple agents, run in parallel, and then aggregate results through a coordinator. A single task can produce hundreds of MB of trace data and tens of thousands of spans.
The challenge is not just storing a chain of events. The challenge is cleaning, splitting, indexing, aggregating, and querying long-running, nested, schema-drifting JSON so that it can support attribution and evaluation.
What the Data Layer Needs for Agent Trace
A data layer for agent trace needs a different set of capabilities from a traditional observability backend.
First, it needs native JSON storage. Agent traces should not require teams to flatten everything into a rigid schema before ingestion. Tool outputs and message structures change too often.
Second, it needs strong JSON cleaning and transformation. Real traces contain dirty data, long fields, invalid structures, and inconsistent types. Teams need SQL functions and transformation primitives that can normalize this data inside the warehouse.
Third, it needs fast access to hot fields. Common query dimensions such as
trace_id
model
tool
Fourth, it needs full-text search inside JSON. Many debugging questions are text questions: did this run contain a certain error string, permission message, user complaint, or abnormal tool output?
Fifth, it needs governance at the JSON path level. Traces may contain user input, secrets, business data, code, credentials, or internal context. Sensitive fields need path-level access control and masking.
Sixth, it needs low-cost object storage. Agent trace volume can grow quickly. Long-term retention is not realistic if every byte sits in expensive compute-coupled storage.
Finally, it needs high-throughput ingestion and incremental computation. Large numbers of users and agent swarms can continuously produce trace data. Evaluation dashboards and aggregate tables should update incrementally, not by repeatedly scanning all historical traces.
Databend’s Minimal Trace Storage and Analytics Architecture
Databend takes a minimal architecture for trace storage and analysis.
Instead of splitting raw data, transactional storage, search, and analytics across separate systems, trace data can flow through one warehouse-centered path:
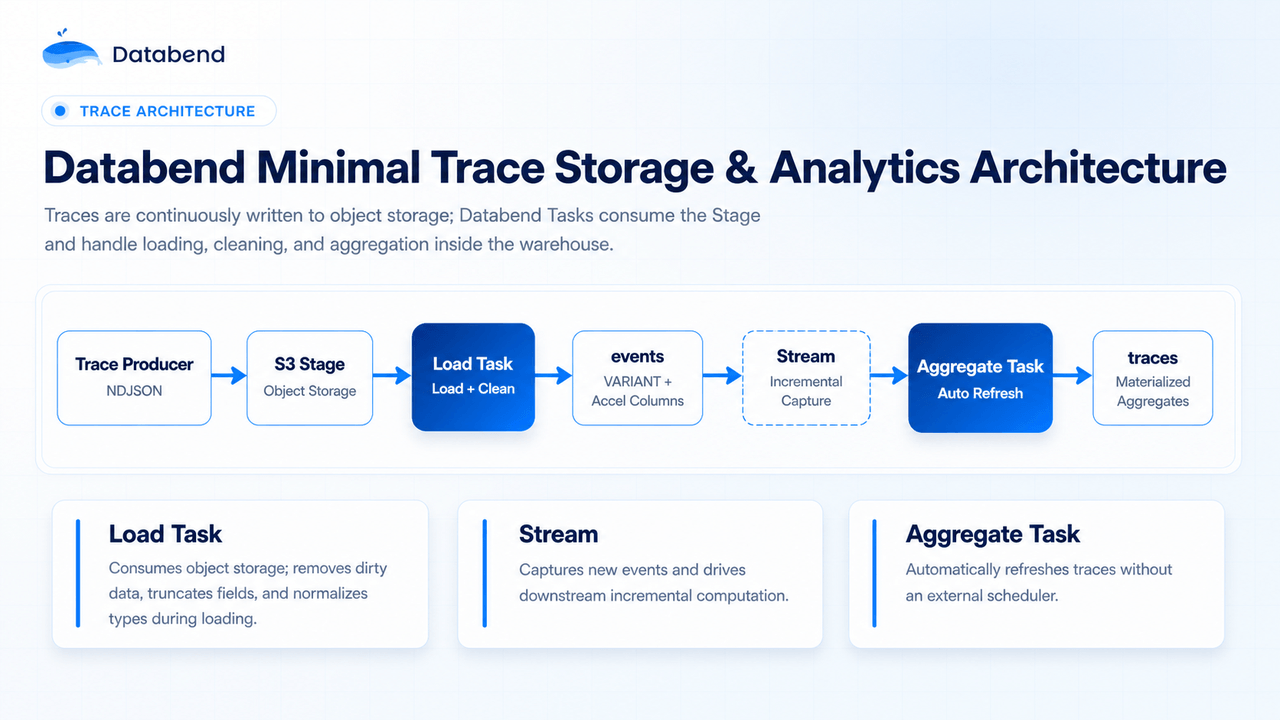
The trace producer continuously writes NDJSON files to object storage. Databend consumes the S3 Stage with a Load Task, cleans the incoming data, and loads it into an
events
The raw JSON can be stored in a VARIANT column. Frequently used fields can be extracted into accelerated columns. Full-text indexes can support search across messages, tool results, errors, and tags. Dirty JSON cleaning and type normalization can happen with SQL functions inside the warehouse.
After new events land, Databend Stream captures incremental changes. Aggregate Tasks then refresh the
traces
The result is a simple architecture:
- Object storage keeps trace retention cost under control.
- VARIANT stores complex semi-structured JSON.
- Accelerated columns make common filters fast.
- Full-text search supports failure investigation.
- Stream and Task enable incremental aggregation.
- SQL and Python Sandbox can power analysis workflows.
The key is not just that traces are stored. They are stored in a form that can be queried, searched, aggregated, replayed, and reused.
One Trace Dataset, Many Upper-Layer Workflows
Once trace data is stored and queryable, multiple workflows can build on top of the same dataset.
- Evaluation can compare agent runs by path, cost, duration, tool sequence, and branch point.
- Replay can reconstruct what the agent saw and did at each step.
- Attribution can explain whether a failure came from prompt design, tool choice, context drift, model behavior, or harness mismatch.
- Training data generation can select successful and failed trajectories for model improvement.
- RL and reward modeling can use real execution traces instead of synthetic task summaries.
This is why trace should not be scattered across separate logging, search, evaluation, and training systems. A fragmented stack makes it harder to control cost, enforce governance, and reason about the source of truth.
For agent workloads, the warehouse is no longer just a BI backend. It becomes the governed data layer for agent behavior.
Trace Is the Foundation for Reliable Agents
Reliable agents will not be built by prompts alone.
They need a data foundation that can answer:
- Where did the agent drift?
- Which step burned tokens?
- Which tool call caused the branch?
- Did the model change improve the run?
- Which traces should become training data?
- Which failures repeat across users, tools, or models?
That is the meaning of Trace is Evals.
For teams building AI agents, coding agents, RAG applications, or agentic workflows, the first step is to preserve the execution record. Store the trace. Clean the JSON. Extract the hot fields. Search the failure paths. Aggregate incrementally. Build evaluation, replay, attribution, and training data on top of the same source of truth.
Databend is built for this kind of agent-ready data workload: open source, Rust-native, S3-native, Parquet-native, and designed to combine analytics, semi-structured data, search, incremental processing, and Python workflows in one modern cloud data warehouse.
Agent reliability starts with trace data you can actually query.
Try Databend Cloud
Start with free credits and try Databend Cloud for agent trace analytics, semi-structured JSON, full-text search, and incremental Stream/Task pipelines: https://app.databend.com/login
Subscribe to our newsletter
Stay informed on feature releases, product roadmap, support, and cloud offerings!