
Debugging Payment Failures With OpenTelemetry and SQL in Databend Cloud
 JeremyNov 4, 2026View Markdown

A payment failure raises two questions: where did the request fail, and which orders did it affect? When logs are in Elasticsearch or Loki, traces are in Jaeger or Tempo, and metrics are in Prometheus, an investigation can involve switching tools and exporting data before joining it with order records.
Databend Cloud is a managed cloud data lakehouse built on the open-source Databend engine. Its lakehouse architecture stores data in object storage and separates storage from compute. It supports SQL queries over structured business tables and semi-structured telemetry. Worksheet, its browser-based SQL editor, is where we will run the queries in this tutorial.
OpenTelemetry (OTel) provides a common approach to instrumenting applications and collecting telemetry. Applications send data through the OpenTelemetry Protocol (OTLP) to a Collector, which processes and exports it. The Databend exporter writes logs, traces, and metrics to three tables. We will use those tables to investigate a simulated payment failure and join logs with spans to calculate the order value involved.
The screenshots and recordings come from an actual run on Databend Cloud. The application and order data are simulated; the query results are from that run. The walkthrough assumes familiarity with SQL, but no previous experience with Databend Cloud.
How the Exporter Stores Telemetry
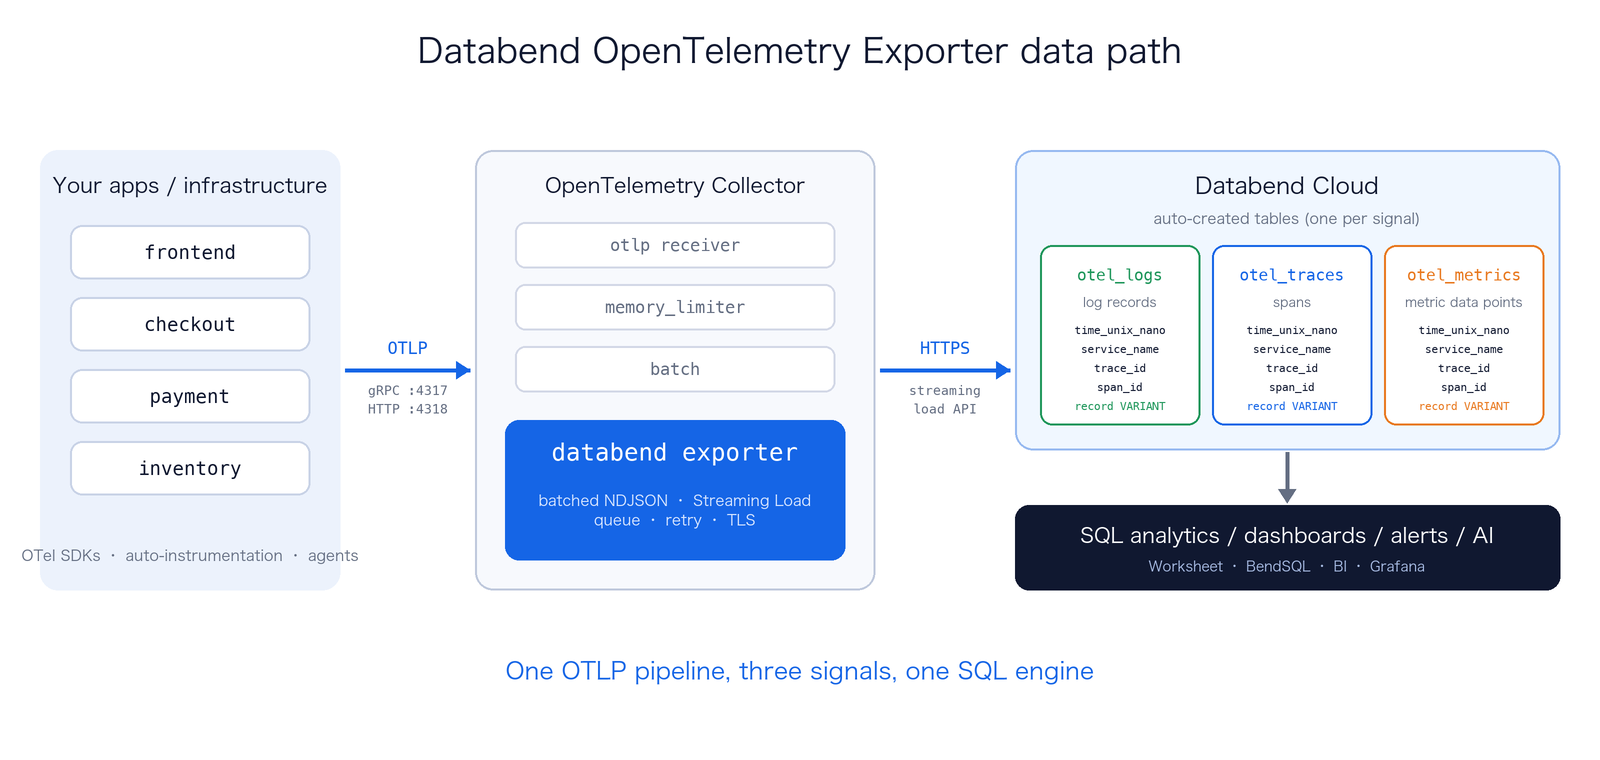
The data follows three steps:
-
Applications use OTel software development kits (SDKs) or automatic instrumentation to send data to the Collector through OTLP.
-
The
exporter encodes each batch as newline-delimited JSON (NDJSON) and writes it through Databend's native HTTP Streaming Load interface.databend -
The records land in
,otel_logs, andotel_traces. You can query them with SQL from Worksheet, BendSQL, business intelligence (BI) tools, or Grafana.otel_metrics
The exporter calls
/v1/streaming_load
Each row holds a log record, a span, or a metric data point. Frequently filtered fields, including the timestamp, service name, trace ID, span ID, name, and metric type, have their own columns. The complete OTLP object goes into the
VARIANT
record
All five metric types are supported: gauge, sum, histogram, exponential histogram, and summary. The exporter preserves the information relevant to each type, including exemplars, bucket boundaries, min/max values, and quantiles.
Databend's TIMESTAMP type has microsecond precision. The exporter therefore stores the original nanosecond timestamps as
UInt64
Sending queues, optional queue persistence, retry backoff, timeouts, Transport Layer Security (TLS), and authentication extensions use the Collector's exporterhelper and confighttp components. Their configuration follows the same conventions as other exporters.
With the default
create_schema: true
schema.sql
create_schema: false
Send Telemetry to Databend Cloud
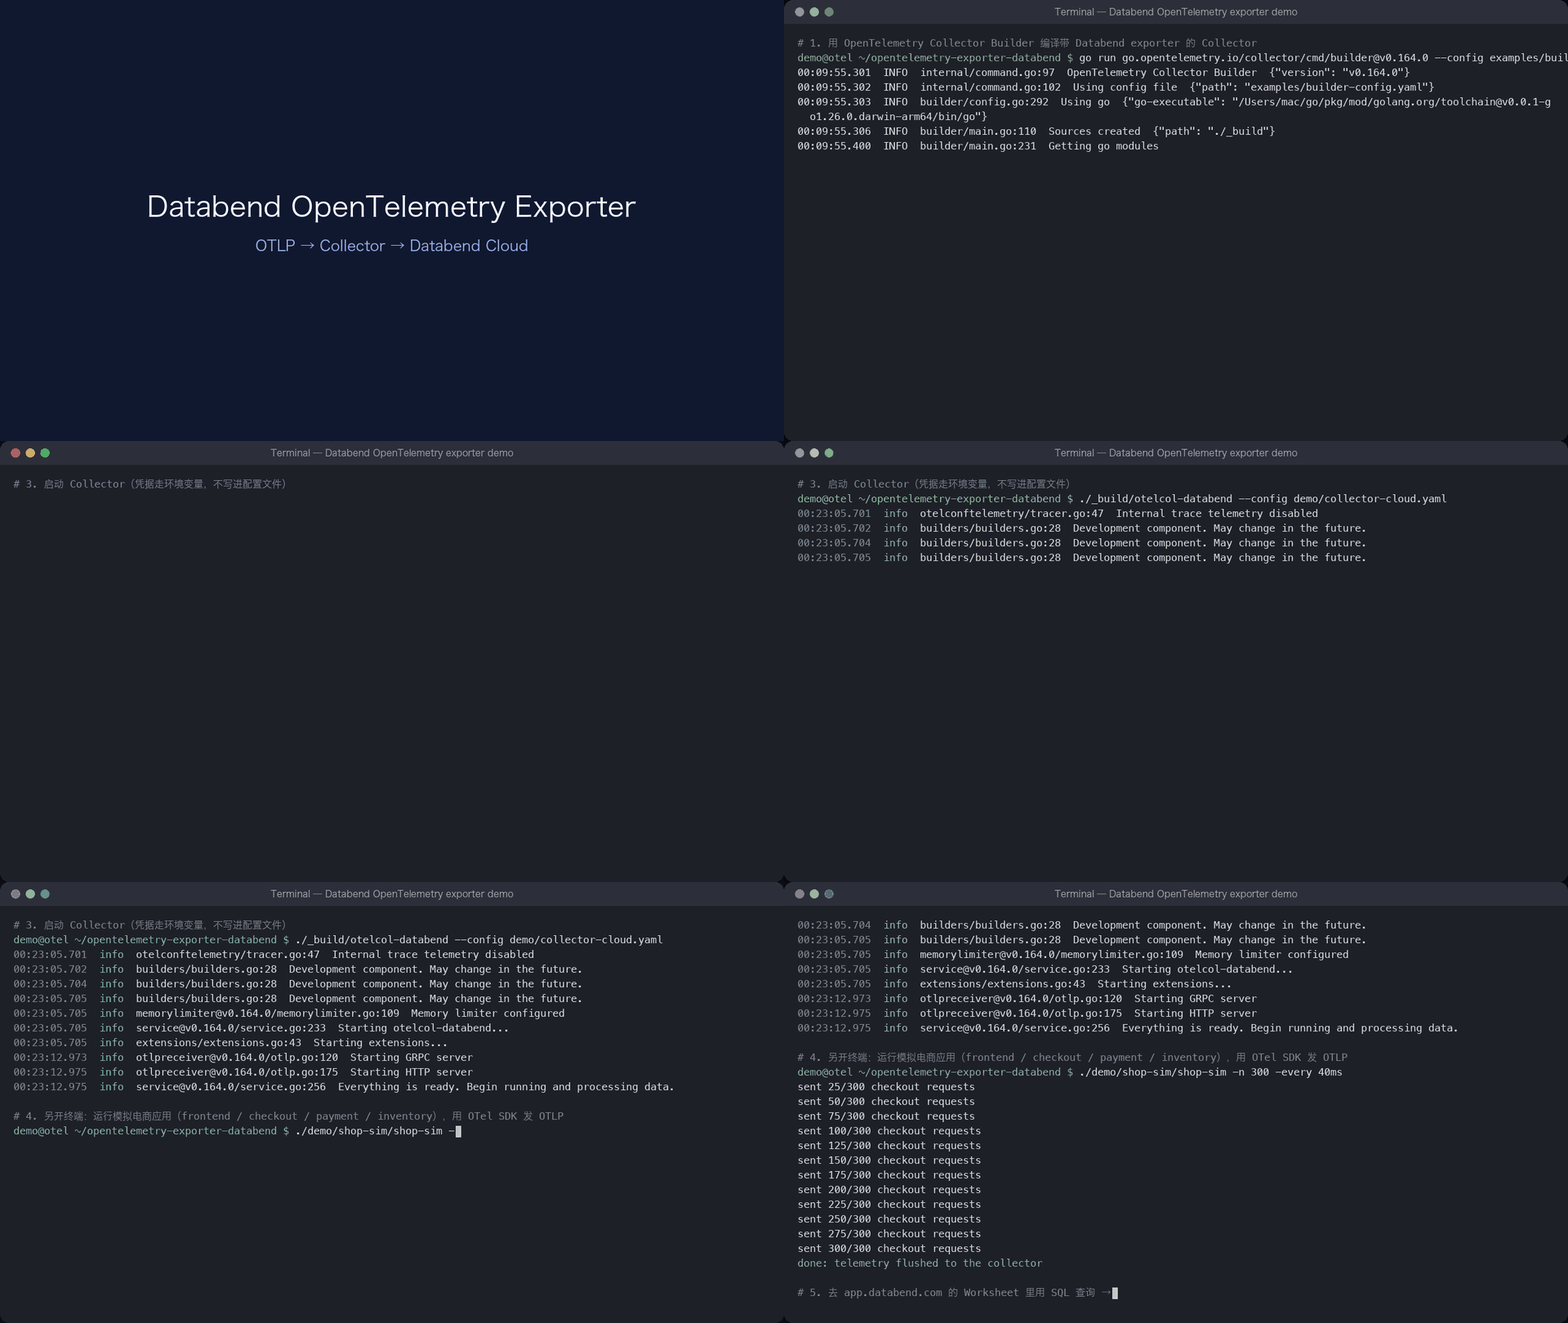
The repository's
demo/
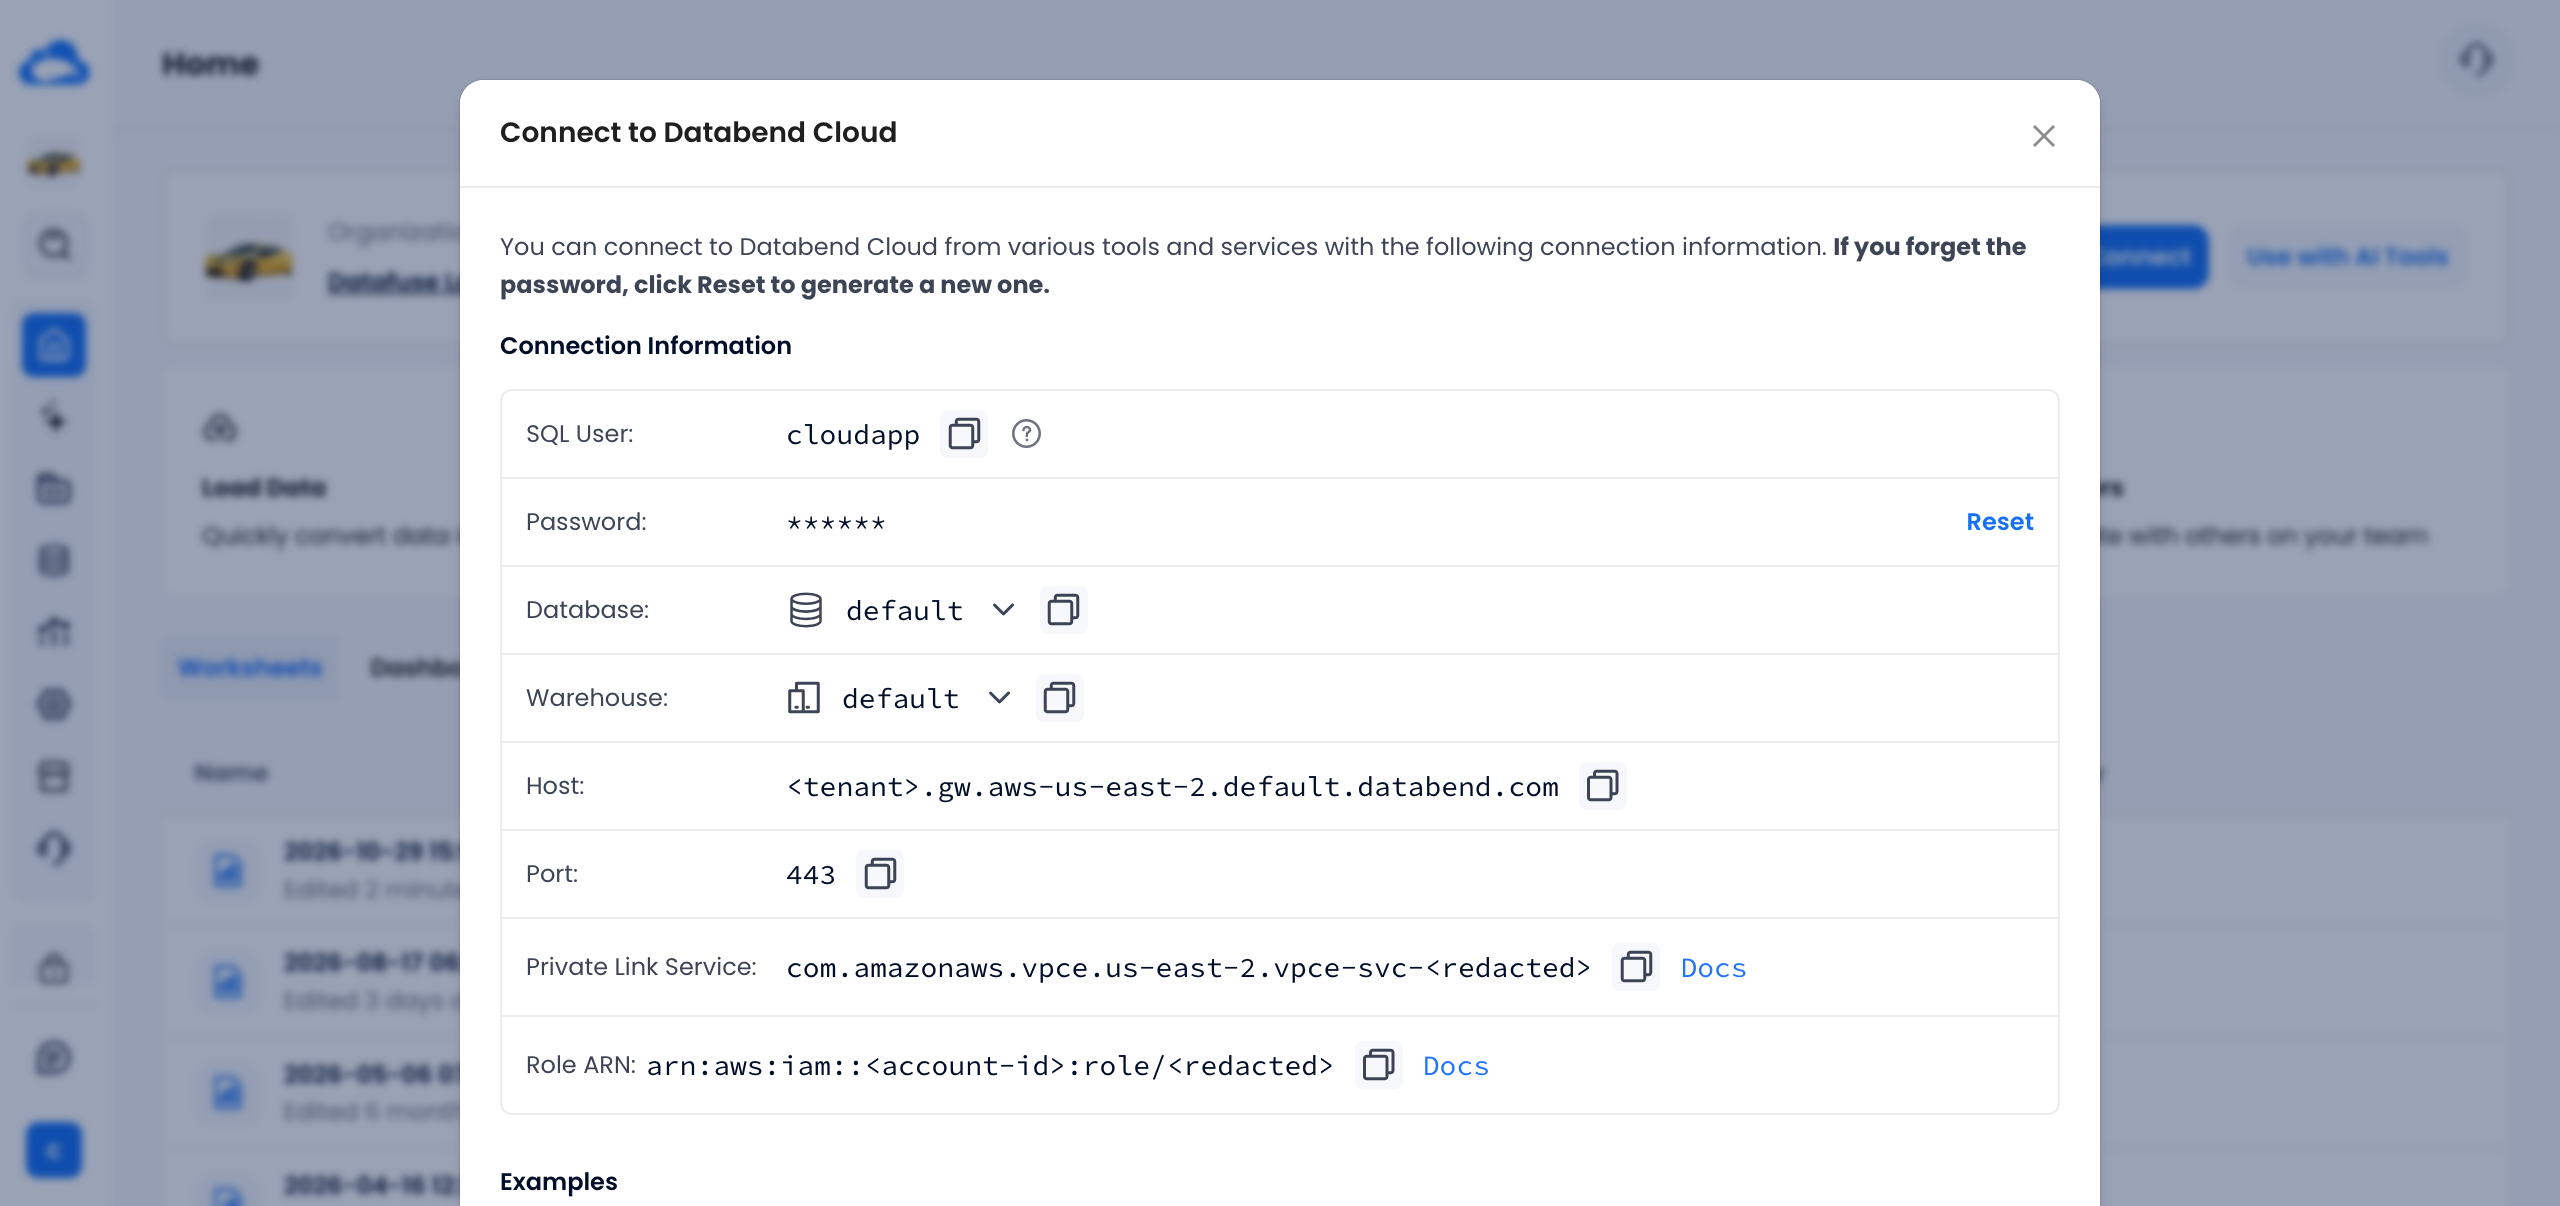
Step 1: Get the Connection Details
Sign in to app.databend.com and click Connect in the upper-right corner of the home page. The exporter needs the Host, in the form
<tenant>.gw.<region>.default.databend.com
Create a dedicated user for the exporter rather than using an administrator account. Run the following SQL in Worksheet:
CREATE ROLE otel_exporter_demo_role;
-- only needed with create_schema: true
GRANT CREATE DATABASE ON *.* TO ROLE otel_exporter_demo_role;
CREATE USER otel_exporter_demo IDENTIFIED BY '<strong-password>'
  WITH DEFAULT_ROLE = 'otel_exporter_demo_role';
GRANT ROLE otel_exporter_demo_role TO otel_exporter_demo;
Step 2: Build a Collector With the Databend Exporter
The exporter used in this demo was not included in the official OpenTelemetry Collector Contrib distribution. Build a custom Collector using the OpenTelemetry Collector Builder (ocb). The repository includes the builder configuration:
git clone https://github.com/databendlabs/opentelemetry-exporter-databend
cd opentelemetry-exporter-databend
go run go.opentelemetry.io/collector/cmd/builder@v0.164.0 \
  --config examples/builder-config.yaml
# output: ./_build/otelcol-databend
This requires Go 1.26 or later. If you maintain your own Collector distribution, add the exporter to the
exporters
Step 3: Configure and Start the Collector
The following excerpt defines the exporter and the signal pipelines. See the repository's configuration examples for the complete configuration, including the receivers and processors referenced here.
exporters:
  databend:
    endpoint: ${env:DATABEND_ENDPOINT}     # https://<Host>
    username: ${env:DATABEND_USERNAME}
    password: ${env:DATABEND_PASSWORD}
    headers:
      X-Databend-Warehouse: ${env:DATABEND_WAREHOUSE}
    database: otel_demo
    create_schema: true
    sending_queue:
      enabled: true
    retry_on_failure:
      enabled: true

service:
  pipelines:
    logs:    { receivers: [otlp], processors: [memory_limiter, batch], exporters: [databend] }
    traces:  { receivers: [otlp], processors: [memory_limiter, batch], exporters: [databend] }
    metrics: { receivers: [otlp], processors: [memory_limiter, batch], exporters: [databend] }
Pass credentials through environment variables so they do not need to be stored in the configuration file:
export DATABEND_ENDPOINT=https://<tenant>.gw.aws-us-east-2.default.databend.com
export DATABEND_USERNAME=otel_exporter_demo
export DATABEND_PASSWORD='<strong-password>'
export DATABEND_WAREHOUSE=default
./_build/otelcol-databend --config collector-cloud.yaml
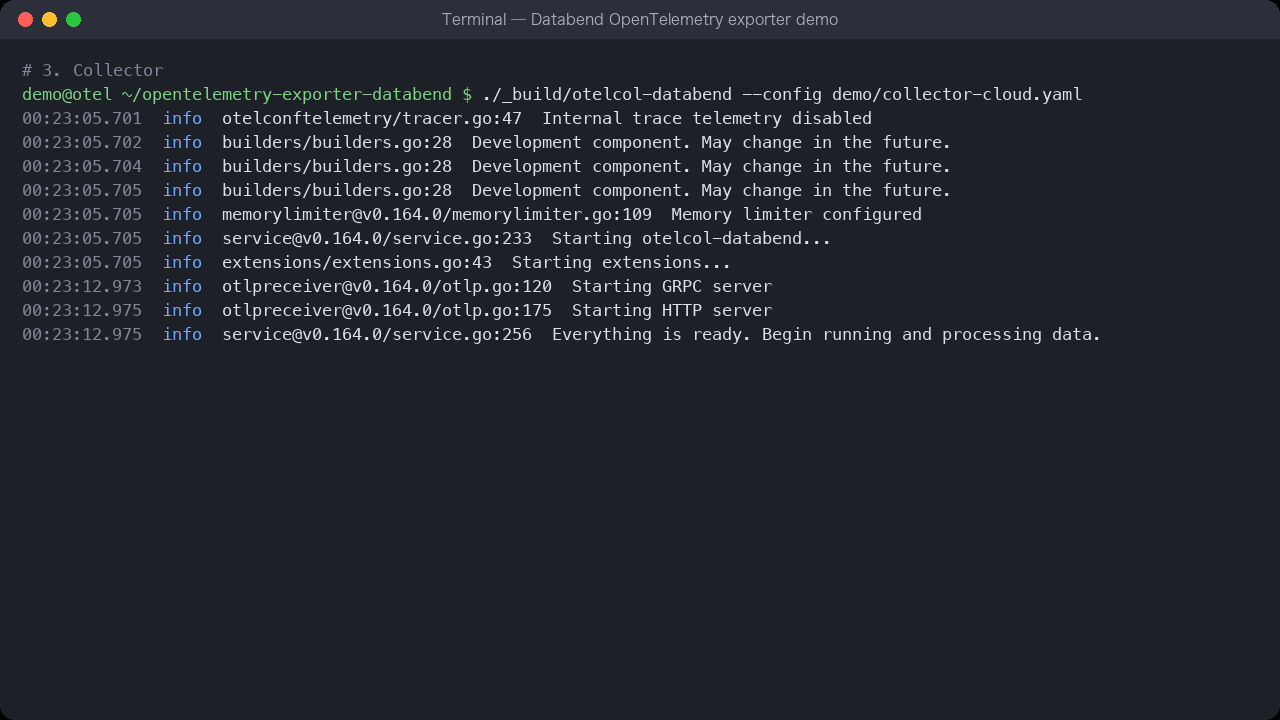
In this run, the message
Everything is ready. Begin running and processing data.
Step 4: Send Data and Check the Tables
Use an application that supports OTLP to send data to
127.0.0.1:4317
127.0.0.1:4318
OTEL_EXPORTER_OTLP_ENDPOINT
The demo application simulates a checkout request passing through four services: frontend, checkout, inventory, and payment. About 8% of requests fail during payment with
card declined
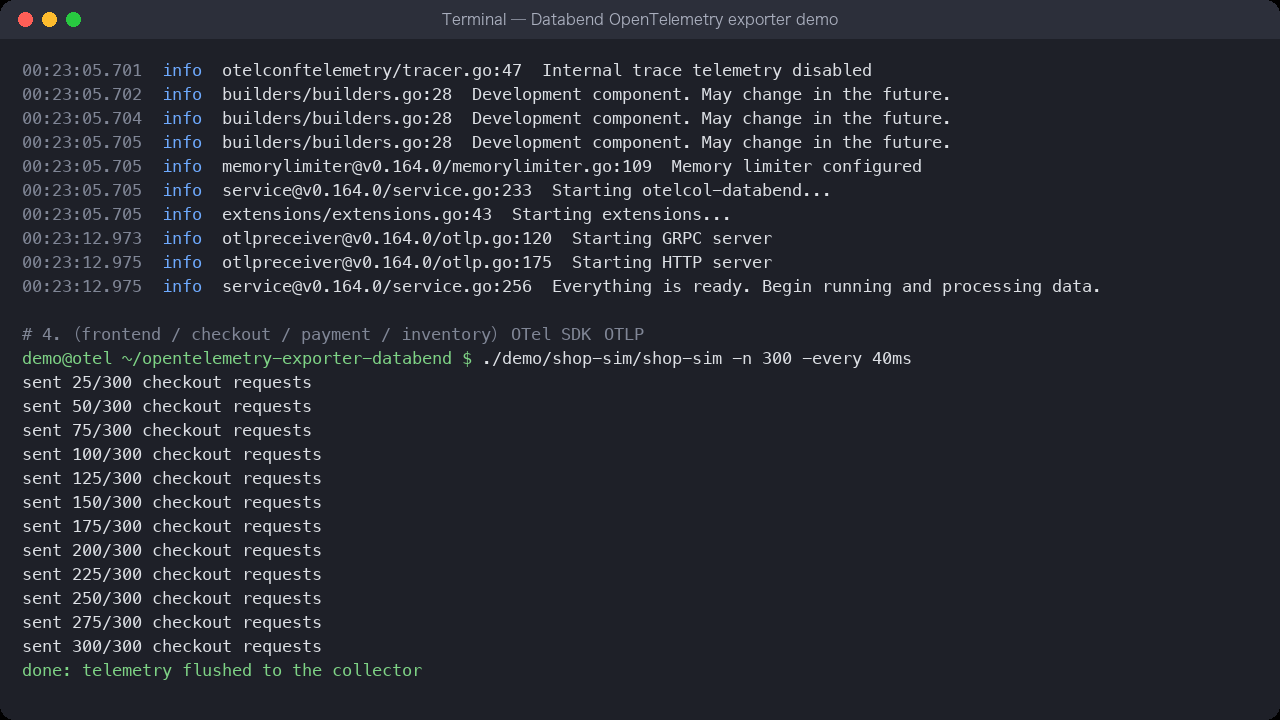
Return to Worksheet to check that the three tables contain data:
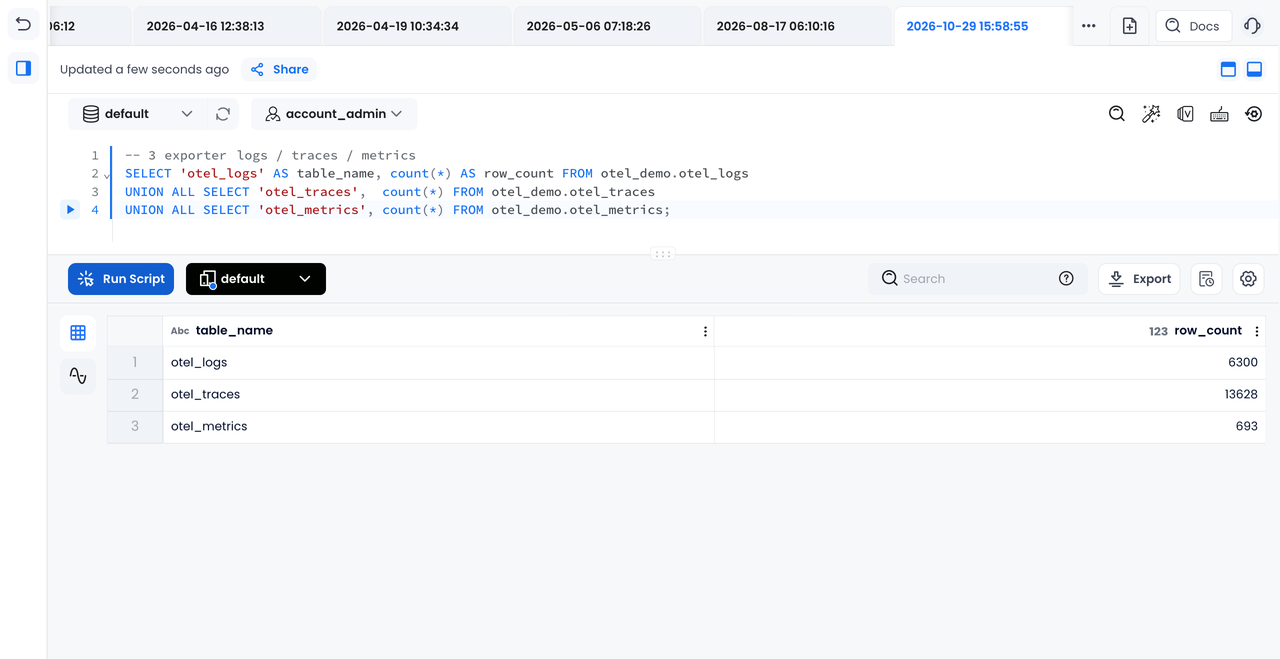
This run simulated 2,100 checkouts and wrote 6,300 log records, 13,628 spans, and 693 metric data points. The Collector produced no error or warning logs during the run.
Investigate Payment Failures With SQL
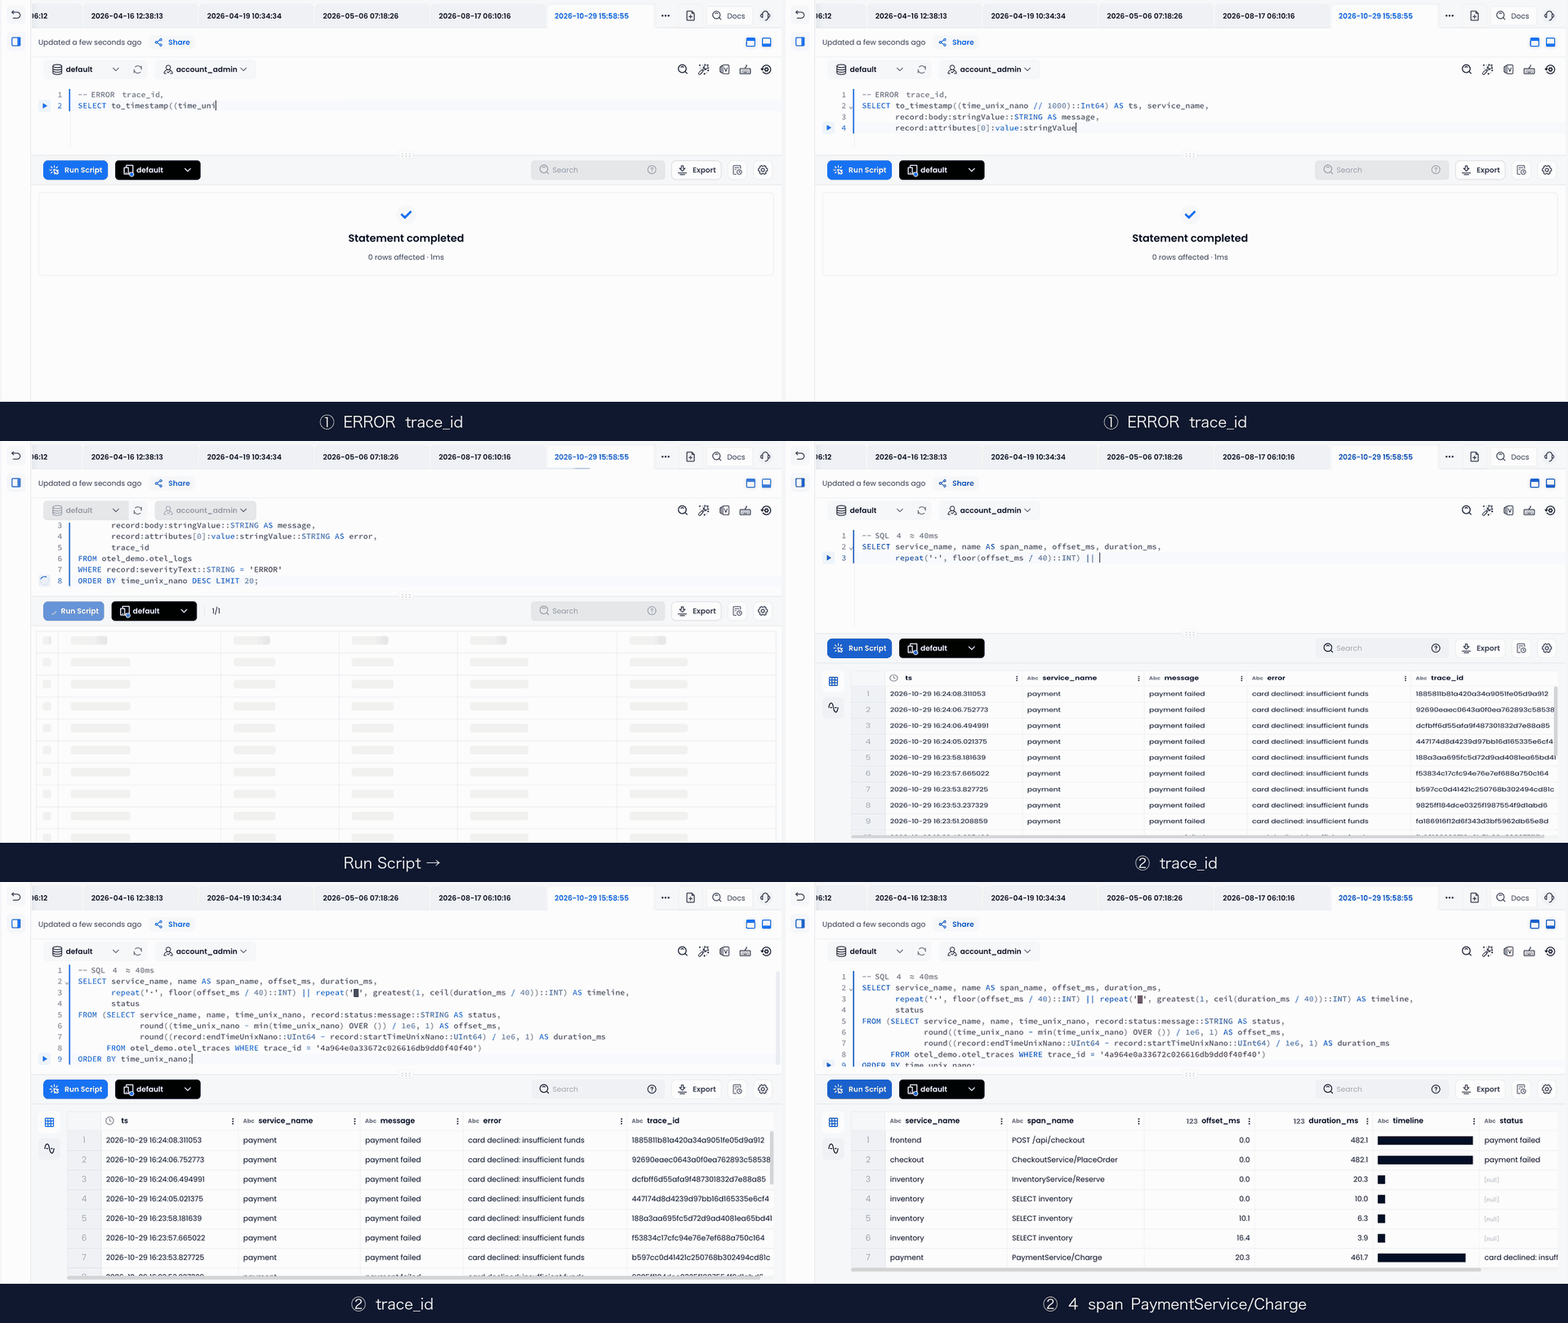
Start with the error logs, then use
trace_id
Find Payment Errors in the Logs
SELECT to_timestamp((time_unix_nano // 1000)::Int64) AS ts, service_name,
       record:body:stringValue::STRING AS message,
       record:attributes[0]:value:stringValue::STRING AS error,
       trace_id
FROM otel_demo.otel_logs
WHERE record:severityText::STRING = 'ERROR'
ORDER BY time_unix_nano DESC LIMIT 20;
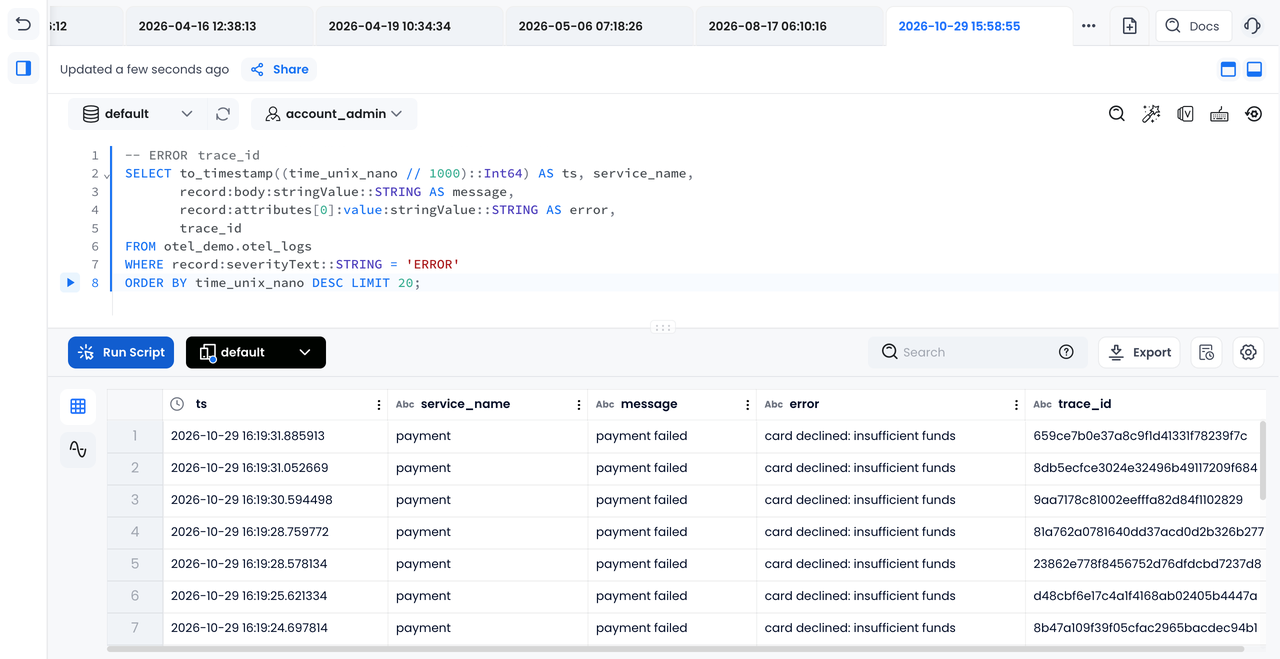
The errors come from the payment service, with the message
card declined: insufficient funds
trace_id
Reconstruct the Request Trace
Choose a
trace_id
repeat()
SELECT service_name, name AS span_name, offset_ms, duration_ms,
       repeat('·', floor(offset_ms / 40)::INT)
         || repeat('█', greatest(1, ceil(duration_ms / 40))::INT) AS timeline,
       status
FROM (SELECT service_name, name, time_unix_nano,
             record:status:message::STRING AS status,
             round((time_unix_nano - min(time_unix_nano) OVER ()) / 1e6, 1) AS offset_ms,
             round((record:endTimeUnixNano::UInt64
                    - record:startTimeUnixNano::UInt64) / 1e6, 1) AS duration_ms
      FROM otel_demo.otel_traces WHERE trace_id = '<trace_id>')
ORDER BY time_unix_nano;
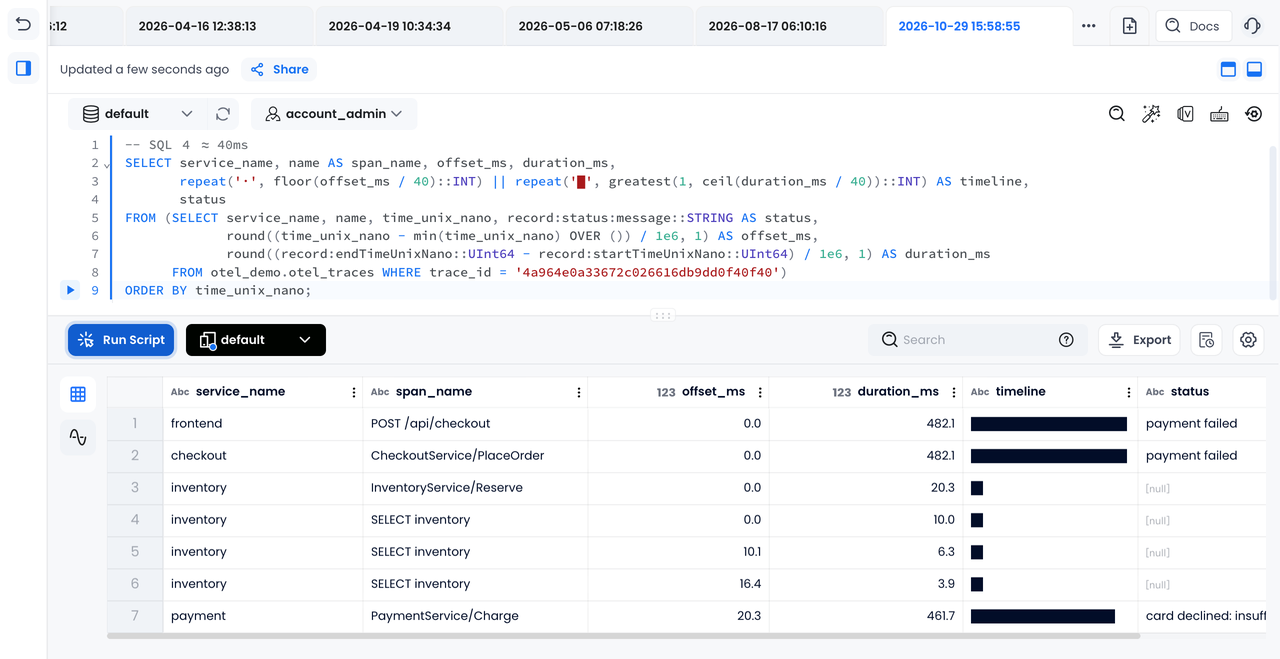
The request took 482 ms. The inventory check took 20 ms, while
PaymentService/Charge
Calculate P95 Latency and Error Counts
Calculate latency and error counts directly from the spans, without defining a separate metric for this query:
SELECT service_name, name AS span_name, count(*) AS spans,
       round(avg(dur_ms), 1) AS avg_ms,
       round(quantile_cont(0.95)(dur_ms), 1) AS p95_ms,
       sum(if(record:status:code::INT = 2, 1, 0)) AS errors
FROM (SELECT *, (record:endTimeUnixNano::UInt64
                 - record:startTimeUnixNano::UInt64) / 1e6 AS dur_ms
      FROM otel_demo.otel_traces)
GROUP BY service_name, span_name
ORDER BY p95_ms DESC;
The checkout endpoint's P95 latency was 450.9 ms. Payment P95 was 430.2 ms, while inventory P95 was 37.4 ms.
Join Logs and Traces to Calculate Failed Order Value
The logs contain order amounts, and the spans contain processing times. Join them on
trace_id
span_id
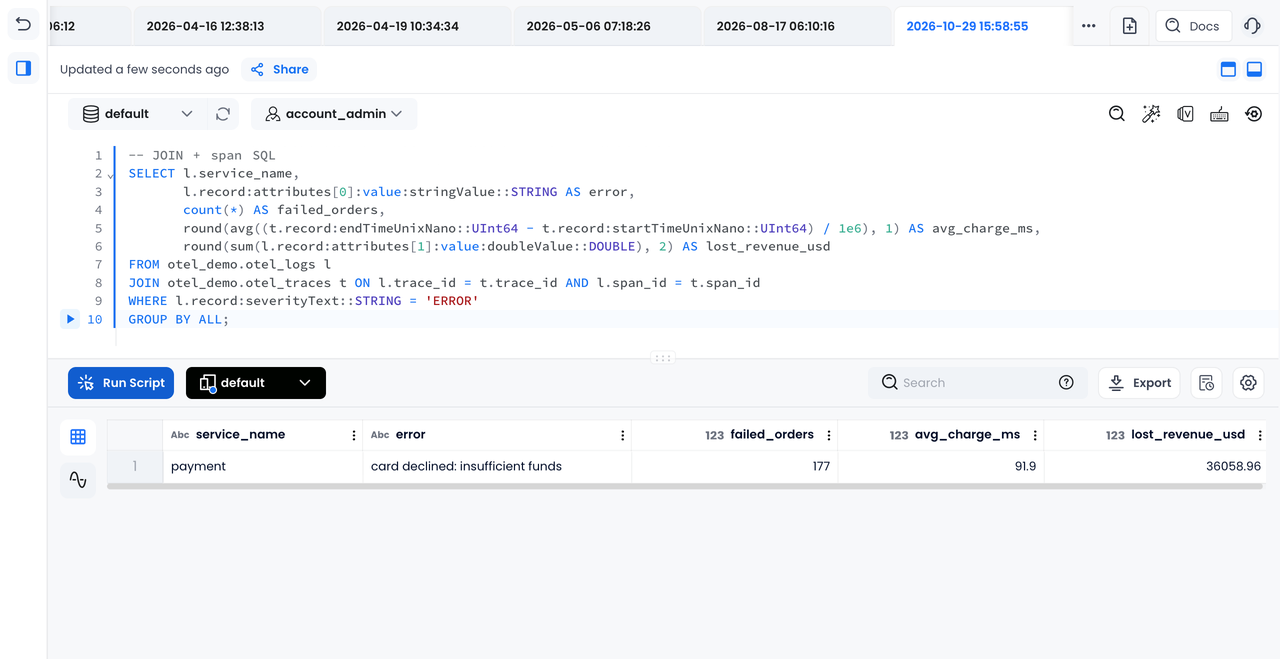
SELECT l.service_name,
       l.record:attributes[0]:value:stringValue::STRING AS error,
       count(*) AS failed_orders,
       round(avg((t.record:endTimeUnixNano::UInt64
                  - t.record:startTimeUnixNano::UInt64) / 1e6), 1) AS avg_charge_ms,
       round(sum(l.record:attributes[1]:value:doubleValue::DOUBLE), 2) AS lost_revenue_usd
FROM otel_demo.otel_logs l
JOIN otel_demo.otel_traces t ON l.trace_id = t.trace_id AND l.span_id = t.span_id
WHERE l.record:severityText::STRING = 'ERROR'
GROUP BY ALL;
In this simulation, 177 orders failed at payment, with a total value of $36,058.96. With logs and traces in Databend Cloud, one JOIN brings the failure reason, order value, and payment duration into the same result. If the order tables are also in Databend Cloud, the analysis can continue by user, channel, or product.
Inspect Histograms and Related Traces
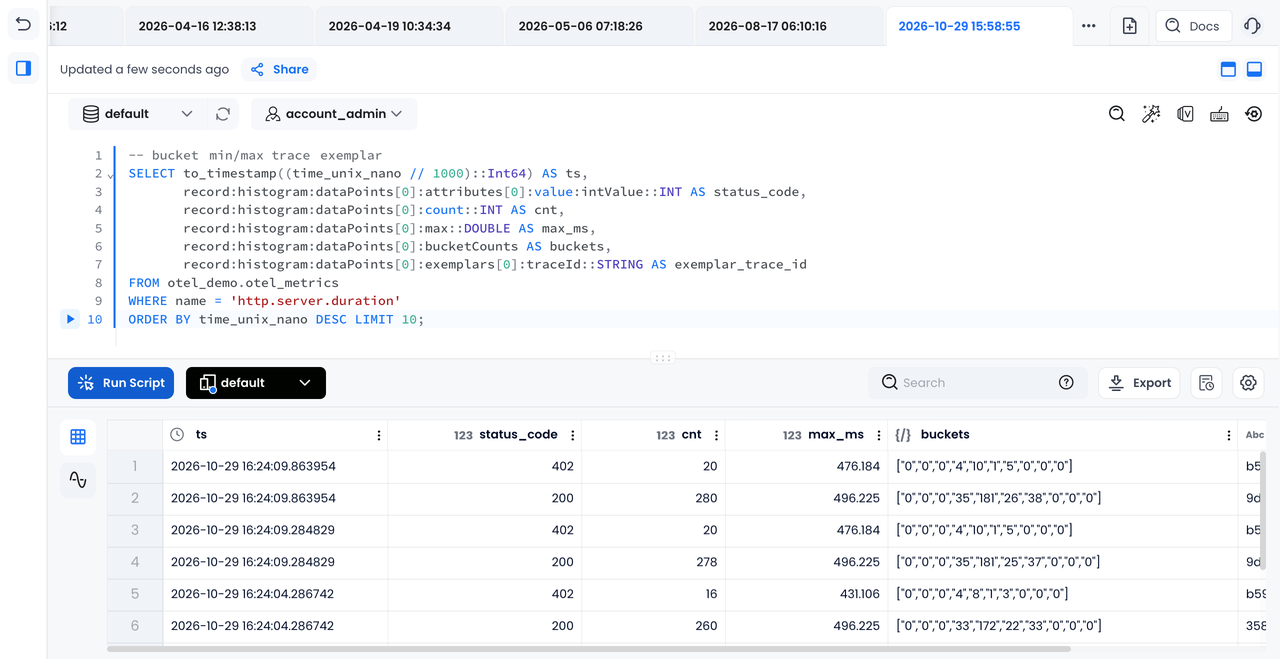
Each row in the metrics table represents one data point. Histogram bucket counts, boundaries, and min/max values are preserved. A
trace_id
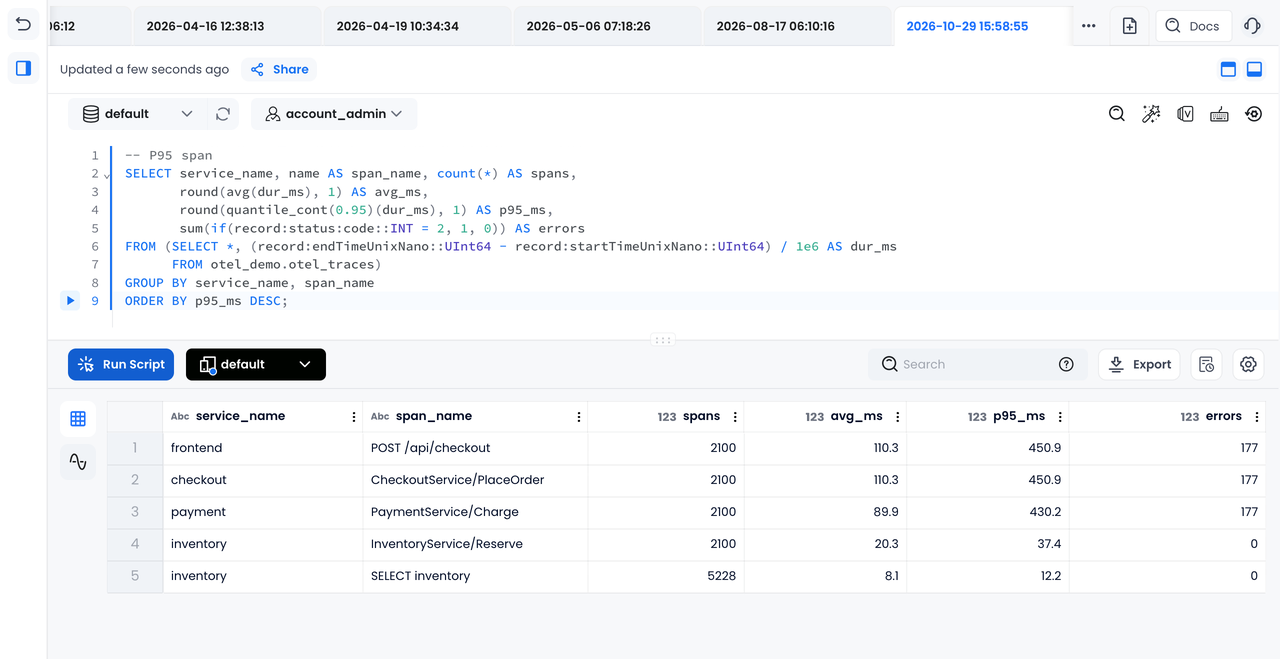
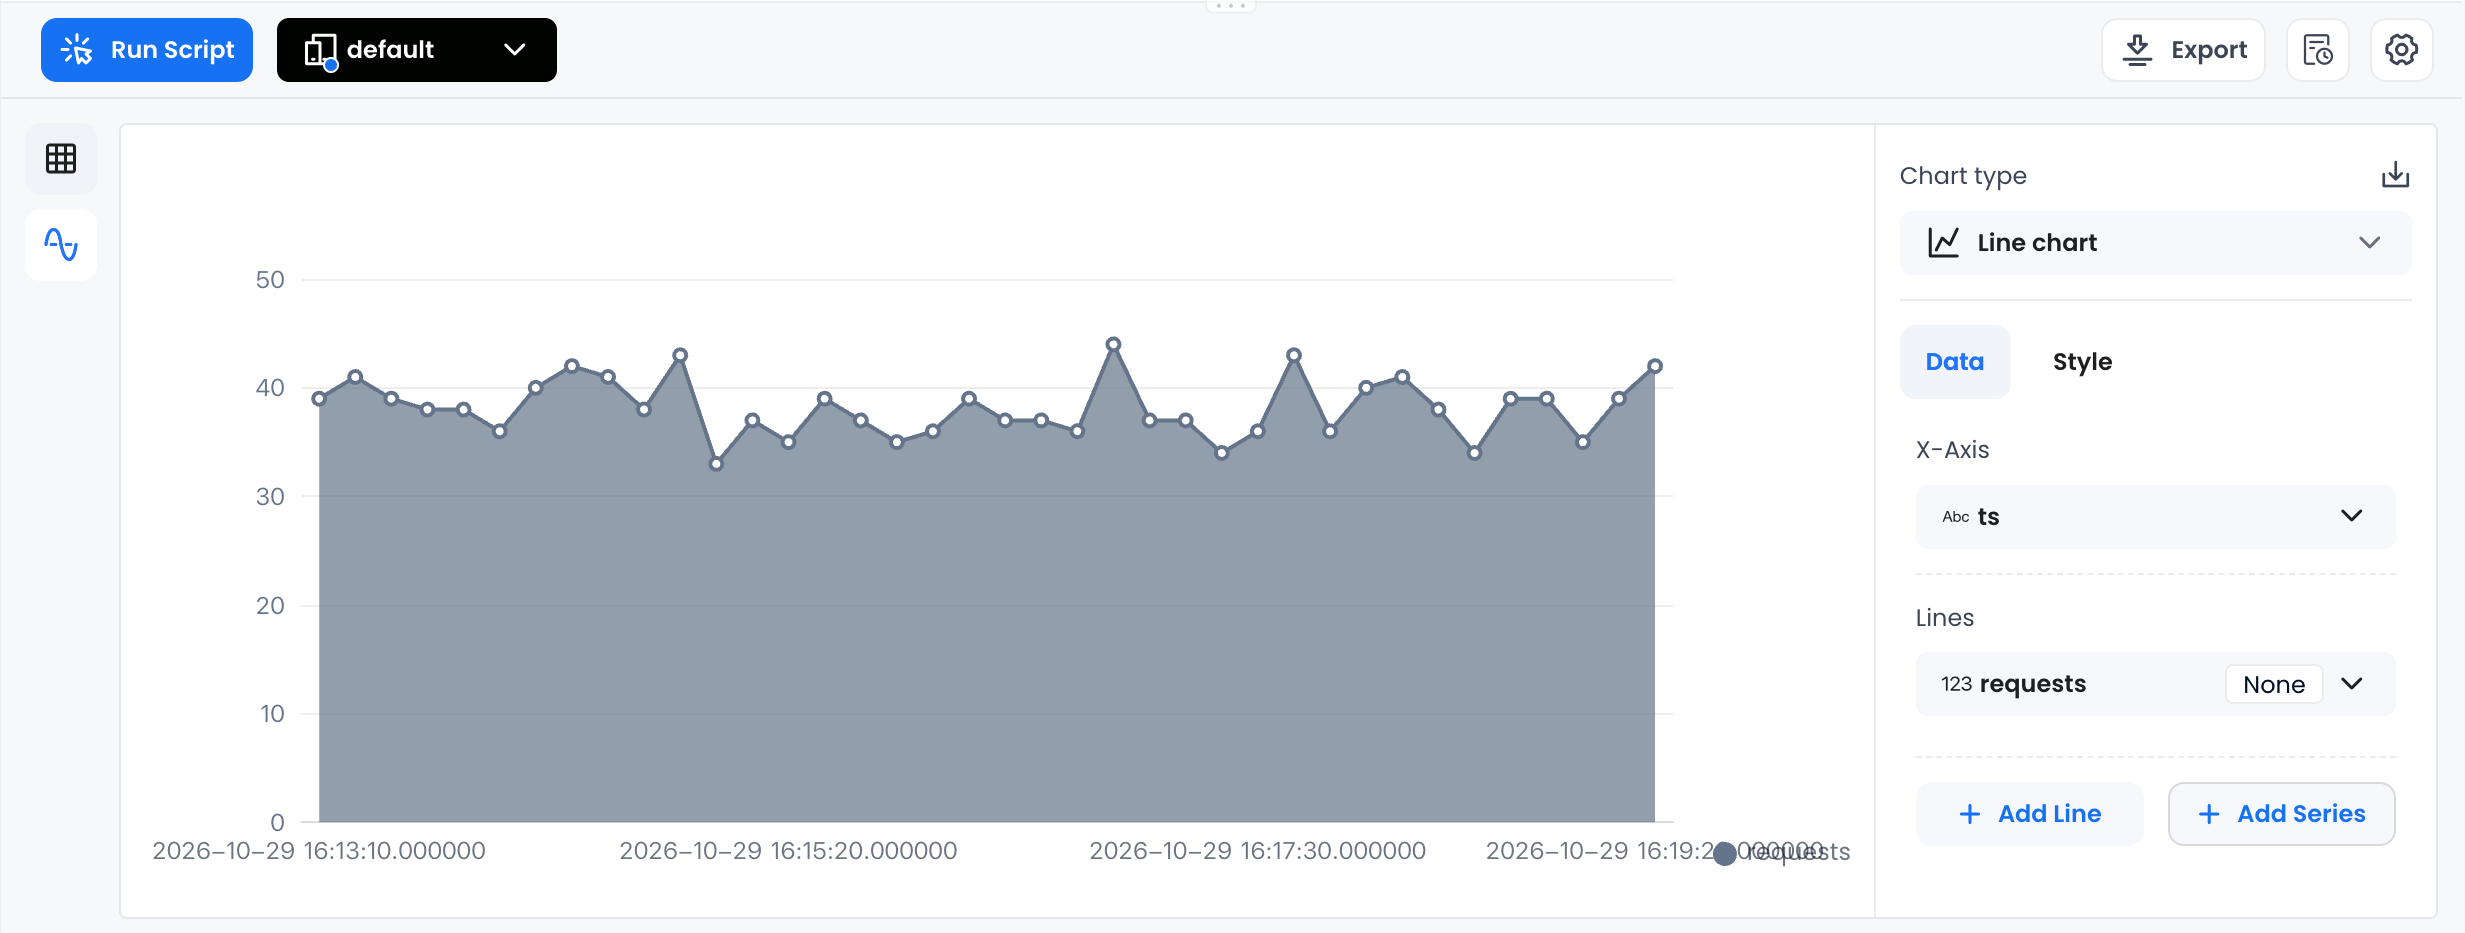
Chart Request Volume
Worksheet can display query results as a chart. This chart groups checkout requests into 10-second windows:
Extend the Investigation With Lakehouse Data
The useful part of this setup is what becomes possible after ingestion. The demo query already combines a failure reason, processing time, and failed order value. When order, user, or billing tables are in the same lakehouse and have suitable join fields, the investigation can extend to affected users or channels without exporting telemetry to another analysis system. The same SQL engine can query all three signals and support analysis of failures over time.
Storage and compute separation also lets teams plan retention independently of compute capacity. Historical logs and traces remain in object storage for incident reviews, capacity planning, or audits, while compute resources are sized for ingestion and query workloads. Keeping more history does not by itself require a matching increase in compute capacity; actual costs still depend on data volume, retention, and read/write activity.
OTel attributes change across services and versions. Keeping them in
VARIANT
record:attributes
record:status:code
Applications already sending OTLP to a Collector can retain that collection path and add the Databend exporter and pipeline configuration. Multiple exporters can keep existing monitoring backends in use. The resulting tables can also be queried through BI tools that support Databend. Its Grafana data source plugin supports SQL-based dashboards and alerts, and AI agents can use the same tables and SQL interfaces.
Understand the Exporter's Limits
The exporter used for this demo was an independent component under development and had not joined the official OpenTelemetry Collector Contrib distribution. The team's plan was to collect community feedback and then pursue a contribution to the project. Its limits at the time of the demo were:
-
Delivery is at-least-once. If a write commits but the connection drops before the response arrives, a retry may insert duplicate rows. There is no deduplication.
-
Queue overflow, exhausted retries, or a process crash without a persistent queue can lose data. For production use, enable queue persistence and configure the batch and memory_limiter processors.
-
Operators manage schema changes.
does not migrate existing tables, and there is no automatic time-to-live (TTL) policy.CREATE TABLE IF NOT EXISTS -
The Profiles signal is not supported.
For the version used in this demo, unit tests included race detection and reported 90.4% coverage. Continuous integration (CI) starts a real Databend instance for end-to-end tests covering all five metric types, nanosecond timestamps, and integer precision. The walkthrough ran on Databend Cloud v1.2.952.
Source Code and Demo Materials
The exporter repository contains the code and documentation. Its
demo/
Subscribe to our newsletter
Stay informed on feature releases, product roadmap, support, and cloud offerings!